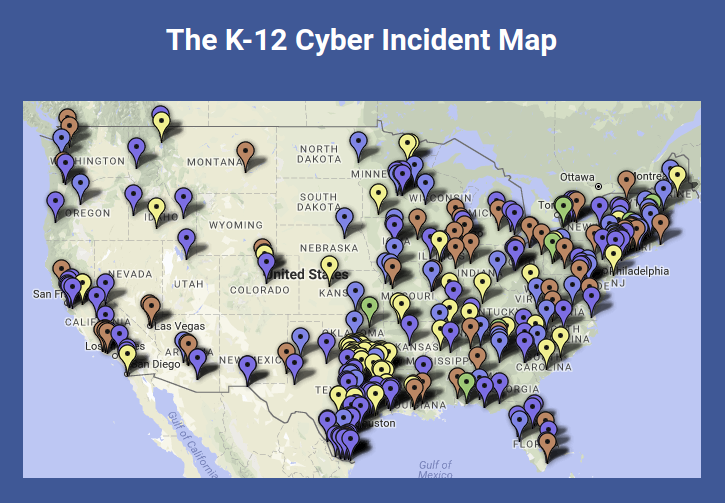
The database powering the K-12 Cyber Incident Map is robust and allows for more fine-grained analyses than are publicly posted on the website of the K-12 Cybersecurity Resource Center. As a benefit to those who support me on Ko-fi, I’ll post monthly updates of more fine-grained statistics. Feel free to use these in articles, public presentations, or internal deliberations, so long as you credit the original source in any material.

The May 31 update included:
- Detailed K-12 cyber incident data, including
- counts by year (2016, 2017, 2018, and 2019 to date); and,
- categorization by major type of incident (overall and by year).
- Detailed school district characteristics, including:
- The number of school districts that have experienced one or more publicly-disclosed cyber incidents since 2016.
- The school districts with the most publicly-disclosed cyber incidents since 2016.
- The demographics of school districts that have experienced one or more incident since 2016 (NCES district categories, including: community type, enrollment size, region, and poverty status)
- How school districts that have experienced one or more incidents since 2016 compare to the universe of all public school districts.
These data are exclusive to the K-12 Cybersecurity Resource Center and a unique benefit to financial supporters of this work!
Should you be interested in different statistics or have ideas for custom research (or are interested in learning about other ways to support or contribute to this work), please feel free to contact me directly. I’d be happy to brainstorm with you and see if there is a way I could assist.